Spatial Data Analysis
R has a range of packages which provide functionality for handling spatial data and performing complex spatial analysis operations. Spatial data analysis is no longer reserved just for experts with expensive hardware and software. R has impressive geographic capabilities which anyone with the desire for exploration of geospatial data can use.
Before we get into geospatial mapping in R, let us introduce some basic ideas about spatial data.
Spatial data comprises of:
- coordinates of the object
- the coordinates relate to a physical location on Earth: coordinate reference system (CRS)
There are two types of CRS:
- Geographical
- specific locations on the surface are defined by a three dimensional model of the Earth.
- longitude and latitude
- Projected
- A conversion of the three-dimensional grid onto a two-dimensional plane.
According to the storing technique, spatial data is one of two types:
Raster data: composed of grid cells identified by row and column. The whole geographic area is divided into groups of individual cells, which represent an image (satellite images)
Vector data are composed of points, polylines, and polygons. For example hospitals, houses etc. are represented by points, while rivers, roads, etc., are represented by polylines. Villages and towns are represented by polygons.
When doing spatial analysis you will also deal with attribute data, which contain the relevant information about the spatial data. The analysis will be based on attribute data attached to geospatial data. Such data could be:
- nominal
- ordinal
- interval data
- ratio data
ie. attribute or measured type of data.
Static Maps: Shape File
R has impressive geographic capabilities and can handle different kinds of spatial data file formats including geojson and KML. We will illustrate the use of the ESRI Shapefile format, which stores nontopological geometry and attribute information for the spatial features in a data set. A shapefile consists minimally of a main file, an index file, and a dBASE table.
- .shp - lists shape and vertices
- .shx - has index with offsets
- .dbf - relationship file between geometry and attributes (data)
To import an ESRI shapefile into R correctly, all three files must be present in the directory and named the same (except for the file extension).
Let us start by reading a shape file of Serbian districts’ boundaries available from GADM maps and data.
First, download the files we will need from the following GitHub repository: https://github.com/TanjaKec/gadm36_SRB_shp. Make sure you save the file into your R-Project working directory before you ask R to execute the following
## If you don't have sf installed yet, uncomment and run the line below
#install.packages("sf")

library(ggplot2)
library(sf)

#pointed to the shape file
serbia_location <- "gadm36_SRB_1.shp"

#used the st_read() function to import it
serbia_districts <- st_read(serbia_location)

# take a look at the file
View(serbia_districts)

# plot the disstricts
ggplot(serbia_districts) +
  geom_sf()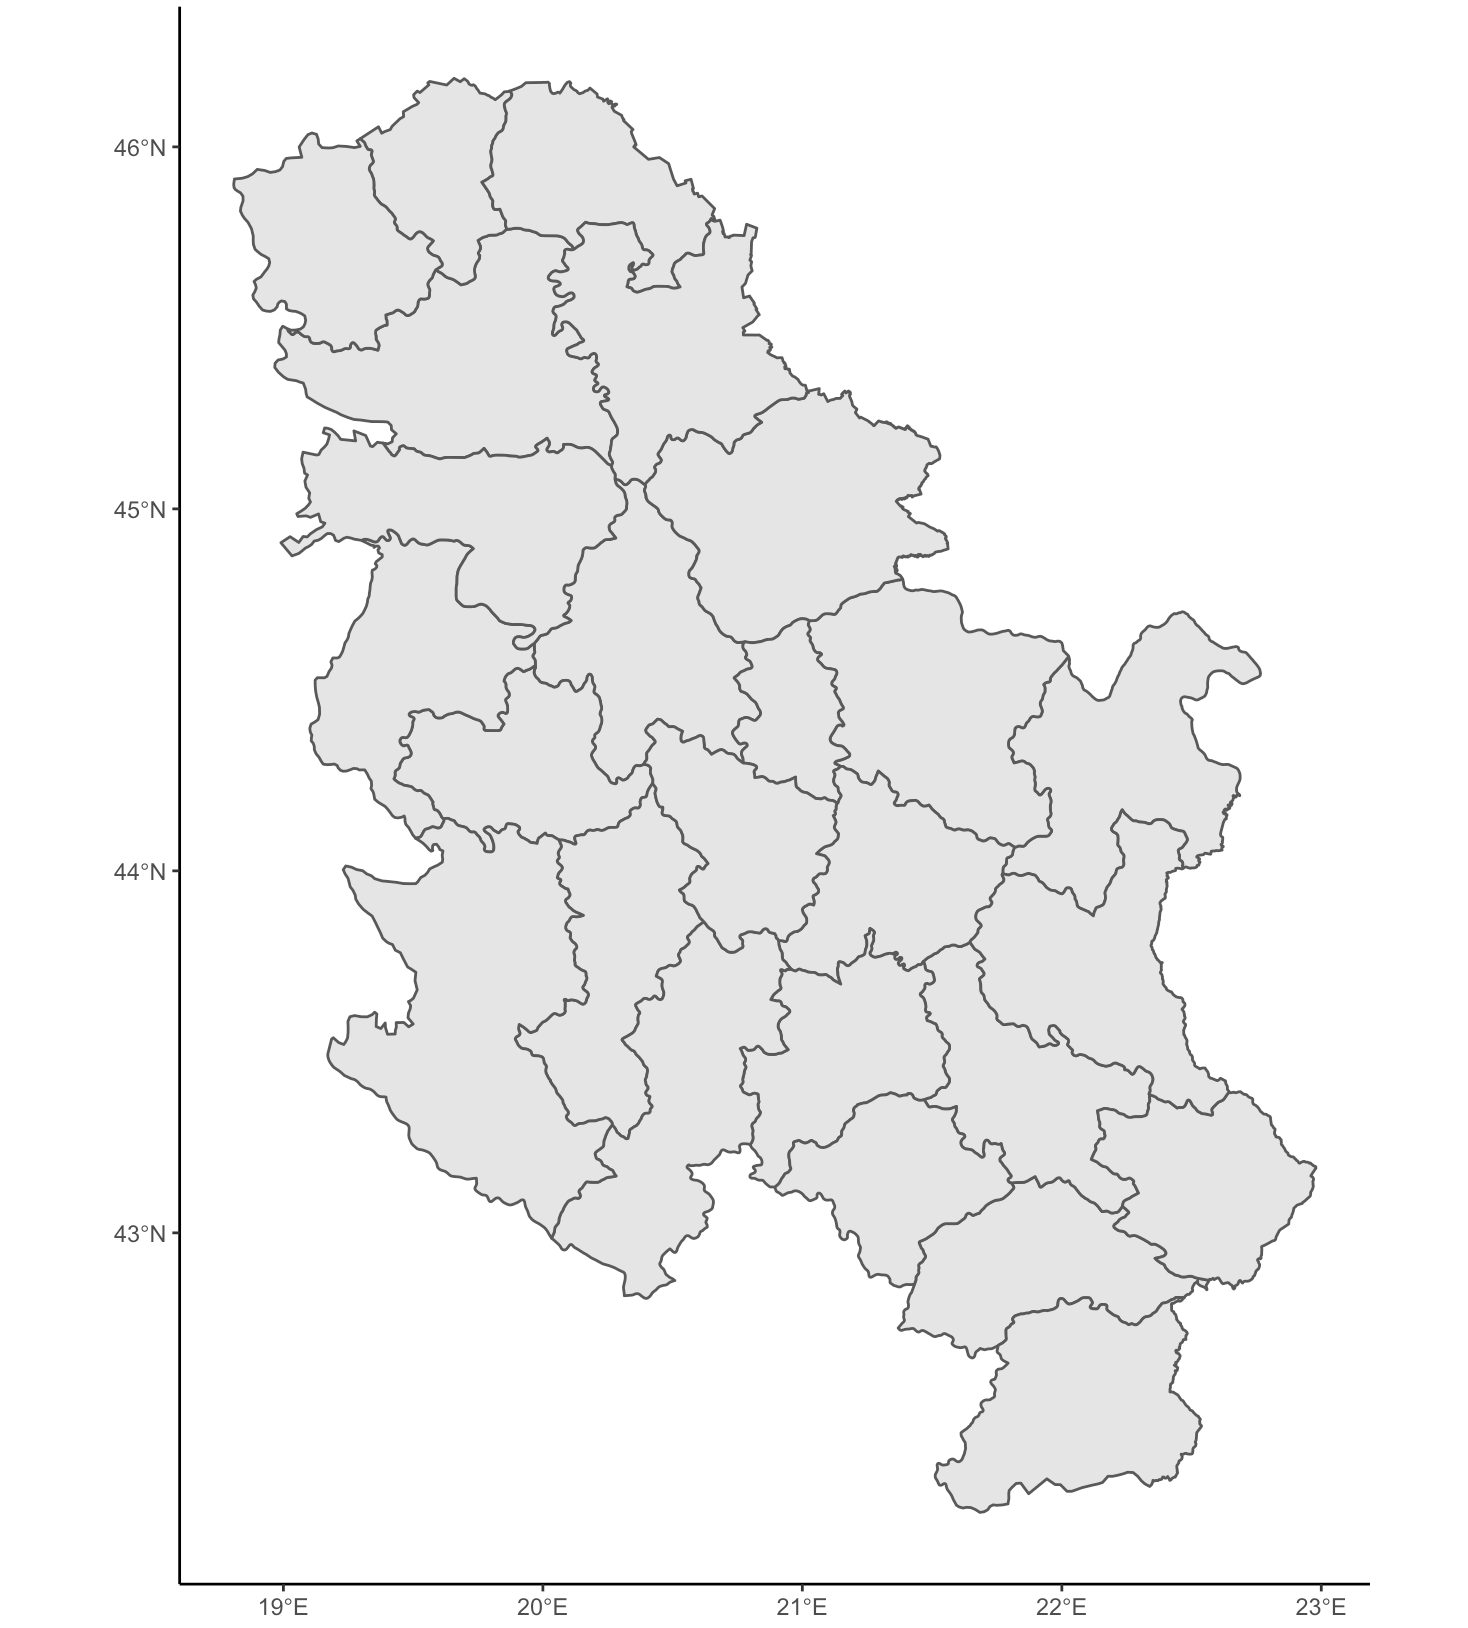
This looks good 😃 Next, we want to add some data to it and do some ‘colouring’. We will incorporate information about the Serbian population in 2017 given “Serbian_Pop.csv” file.
population <- read.csv("Serbian_Pop.csv", fileEncoding = "UTF-8")
View(population)

library(dplyr)

serbia_pop <- left_join(serbia_districts, population,
                          by=c("NAME_1" = "District"))

View(serbia_pop)


ncol(serbia_districts)

ncol(population)

ncol(serbia_pop)

names(serbia_pop)


ggplot(serbia_pop) +
  geom_sf(aes(fill=total_pop)) +
  scale_fill_distiller(direction = 1, name = "Population") +
  labs(title="Population of Serbia for 2017", caption="Source: Statisticki Zavod SR")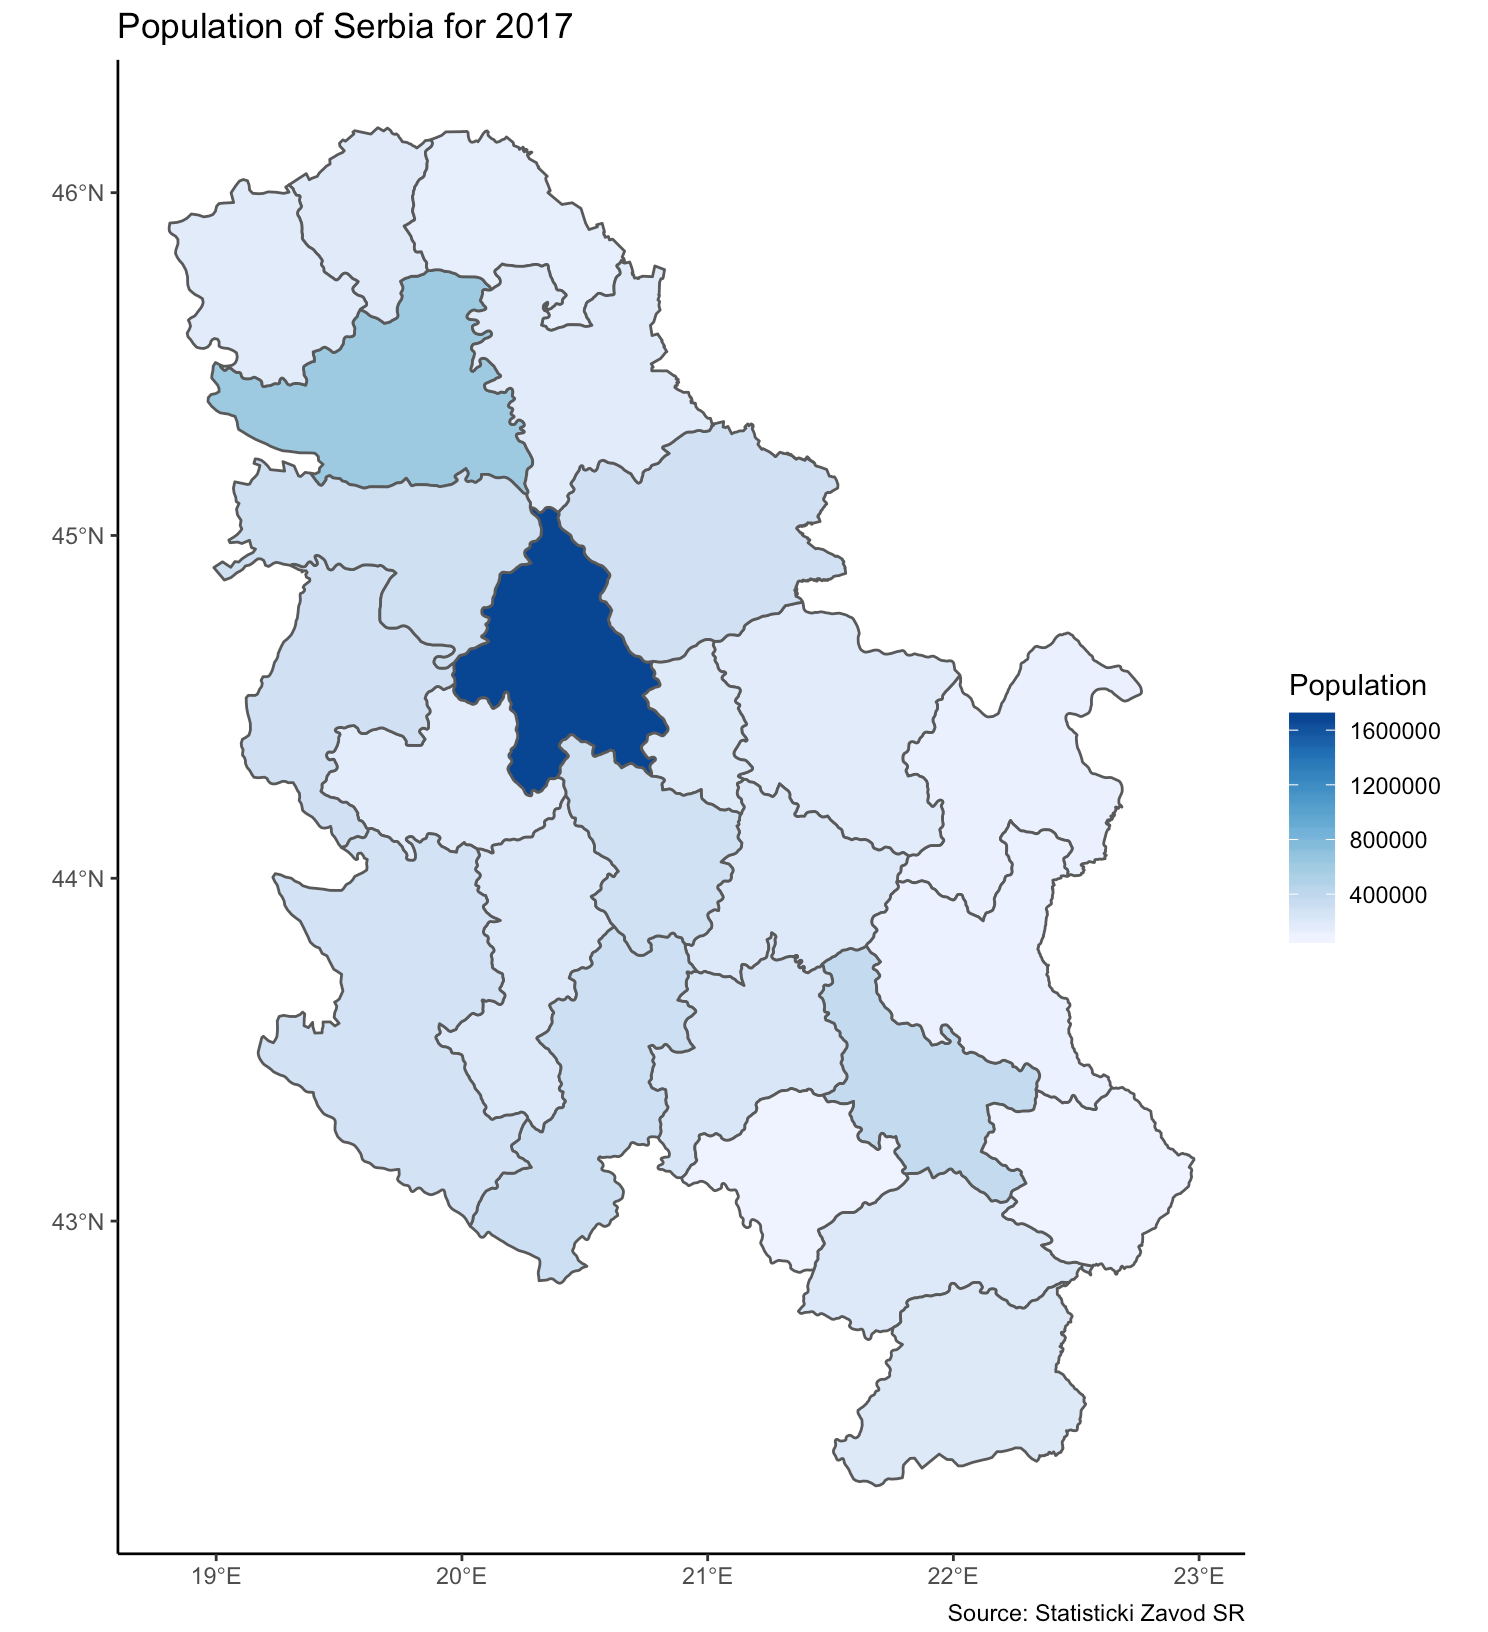
Sometimes you might want to present regions in the plot as a set of multi-panel plots. Remember, you can use the facet facility of ggplot library to do so.
ggplot(serbia_pop) +
  geom_sf(aes(fill = total_pop)) +
  scale_fill_distiller(direction = 1, name = "Population") +
  labs(title="Population of Serbia for 2017", caption="Source: Statisticki Zavod SR") +
  facet_wrap(~NAME_1)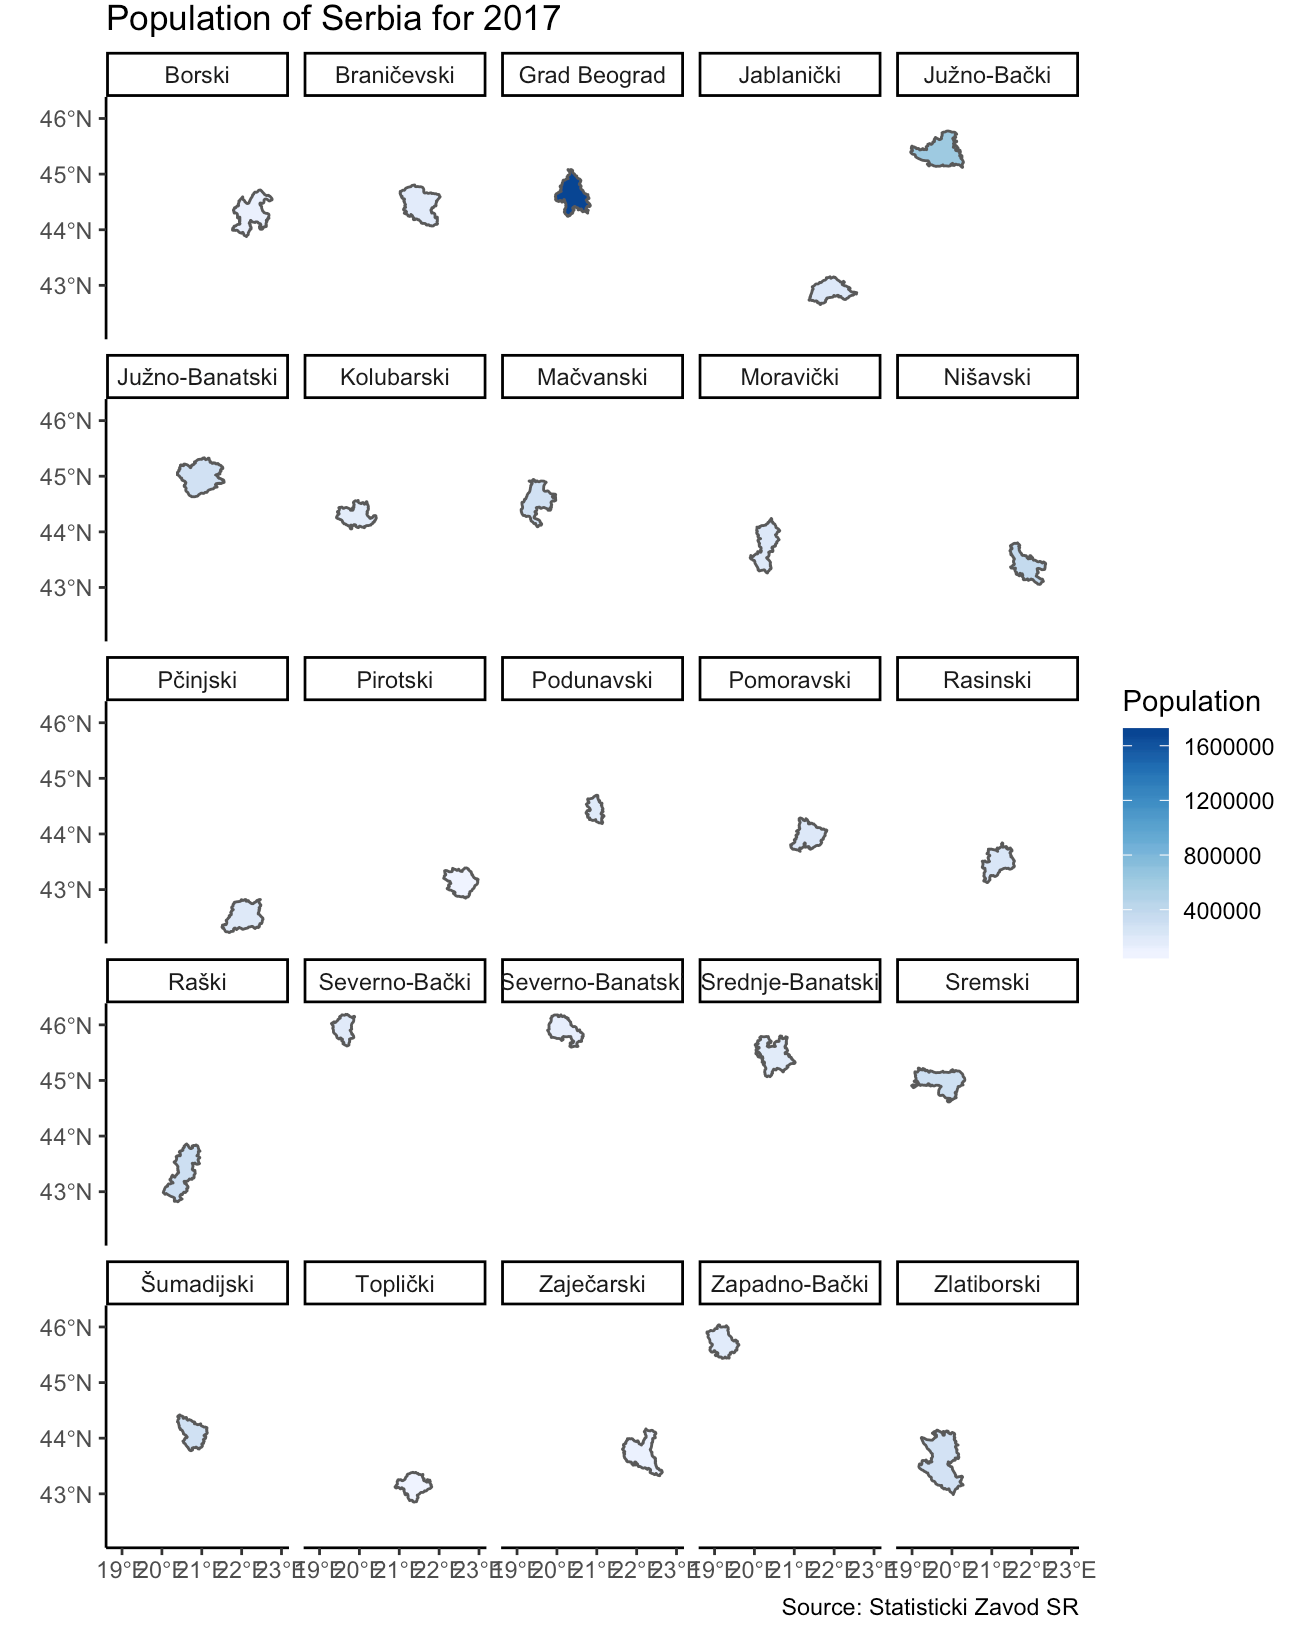
Interactive Maps: leaflet
Leaflet is one of the most popular open-source JavaScript libraries for interactive maps that was integrated into R, by a team of people from RStudio. We will illustrate how easy it is to plot a location map using the leaflet package, but you can learn more about this package from the Leaflet for R website.
## If you don't have leaflet installed yet, uncomment and run the line below
#install.packeges("leaflet")
library(leaflet)
# Initialize and assign us as the leaflet object
us <- leaflet() %>%
  # add tiles to the leaflet object
  addTiles() %>%
  # setting the centre of the map and the zoom level
  setView(lng = 21.43667, lat = 41.99578, zoom = 15) %>%
  # add a popup marker
  addMarkers(lng = 21.43551, lat = 41.99405, popup = "<b>Ciao!</b><br><a href='http://balkansmedia.org/innovation-lab/2nd-media-innovation-lab-master-classes-and-presentations'>2nd Media Innovation Lab! 😀</a>")

us
Here is an interesting website which introduces all kind of possibilities when creating maps with ‘leaflet’. You should check it out and explore further for yourself.
From its original application as a statistical programming language, R has come a long way and has become very powerful in supporting spatial analysis. All R packages include vignettes with explanations of the functions’ syntaxes and often very helpful mini-tutorials that illustrate the practical uses of the functions around related problems. CRAN Task View for Analysis of Spatial Data provides a list of available libraries in R for geographical mapping that are commonly used when undertaking spatial analysis and mapping projects in R.
YOUR TURN 👇
Practise by doing the following set of exercises:
Read a shape file of Serbian districts’ boundaries available from GADM maps and data and plot population per square kilometre available form ‘Serbian_Pop.csv’ used in the exercise.
Create a map pointing out your favourite hang-out places using the leaflet package.
useful links:
R for the analysis of spatial or spatio-temporal data (blog)
Geocomputation with R: a book on geographic data analysis, visualisation and modelling.
Creating Interactive Spatial Maps in R Using Leaflet
© 2020 Sister Analyst